gene therapy
A unique AAV titer solution from harvest stage to product formulation
Purpose
Introduction
AAV capsids are a leading modality for in vivo gene delivery. Complete and precise characterization of capsid particles, including capsid and vector genome concentration is necessary to safely and efficaciously dose patients. It is important to determine the virus concentration at different stages of the process to optimize the production yields. BLI is a rapid label-free method for quantitation of AAV serotypes.
Gator® AAVX probes are high specificity, nanobody-based biosensors that enable direct capture and quantification of different AAV serotypes in only 2 minutes from crude lysates, column eluates, cell lysates, and cell culture supernatants. They serve as an alternative to traditional, time-consuming analytical methods such as qPCR, ddPCR, Dot blot, and ELISA. The Gator AAVX probe uses the proven aptureSelect™ (Thermo Fisher Scientific) high affinity and high specificity anti-AAVX nanobody.
Gator® HS AAV kit combines the simple workflow of Gator BLI with nanobody-based biosensors, buffers, and detection and amplification reagents for high sensitivity quantitation of different AAV serotypes (except AAV9 virus). The assay is well suited for viral vector development from harvesting to final product QC with a dynamic range of 1E+07 to 5E+09 vp/mL and recovery of over 80%.
In this application note, AAV2 capsid concentration is determined from crude cell lysate using both the AAVX probe and HS AAV kit to demonstrate the applicability of these Gator Bio solutions.
Materials Used
- AAVX Probe – Part Number: 160017, Gator Bio
- HS AAV Kit -Part Number: 350003, Gator Bio
- Quantitation (Q) Buffer Part Number: 120010, Gator Bio
- Kinetic (K) Buffer Part Number: 120011, Gator Bio
- Regeneration (R) Buffer with No Salt Part Number: 120063, Gator Bio
- Microplate, 384 Wells, PP, F-Bottom Part Number: 781209, Greiner Bio-One
- Max Plate Part Number: 130062, Gator Bio
- BLI 96-Flat Plate, Polypropylene Part Number:. 130150 (Pack), 130260 (Case), Gator Bio
Method
Samples and standards
- A standard curve was generated using the same AAV serotype (AAV2) as the sample(s) to be quantified.
- The standards were diluted in a buffer matrix that was an exact match of the unknown sample(s).
- The standards were prepared over a concentration range that bracketed the concentration of sample(s).
- A blank was run for all experiments to serve as a reference for background subtraction during data analysis.
AAVX probe experiments
The AAV2 standards and samples were prepared and diluted at 1:10, 1:20, and 1:40 in buffer diluent. Four different diluent buffers were used to test the behavior of the assay under different conditions: (1) PBS+0.001% pluronic, (2) Quantitation (Q)
buffer (Part Number: 120010, Gator Bio), (3) Kinetic (K) buffer (Part Number: 120011, Gator Bio), and (4) PBST buffer. A reference was also prepared using a blank sample matrix diluted in the same solvents and at the same dilution factor as the samples.
To minimize background response from non-specific binding (NSB), the AAVX probes were pre-wet for a minimum of 10 minutes in a buffer/matrix that was an exact match to that of the analyzed samples. The surface chemistry of the AAVX probe is stable over a broad pH range. Therefore, the AAVX probes are regenerated using 10mM Glycine at pH 1.7, since AAV binding to the probe is disrupted at this low pH. The probes can be reused at least 10 times without showing significant loss of binding to AAV. AAV serotypes and sample matrix affect regeneration performance, therefore protocol development and formulation studies are recommended for optimal regeneration conditions.
HS AAV kit experiments
The AAV2 standards and samples were diluted at 1:20 using Q Buffer. Several dilution factors were tested to ensure that the sample concentration was within the recommended dynamic range as provided in the HS AAV Protocol. A reference was prepared using blank sample matrix diluted in Q buffer at the same dilution factor as the samples. Please note that HS AAV probes are non-regenerable and the AAVX probes cannot be used for the HS AAV experiments.
Preparation of cell lysate
The crude cell lysates were prepared as follows (see Figure 1 below for an illustration of this workflow):
- Non-transfected and transfected HEK293 cells were grown in Expi293 media (7.2E+06 cells/mL) to which 0.1% Tween-20 was added.
- Cell lysate was frozen at -80°C for 40 minutes then warmed in an incubator at 55°C until thawed. This was repeated 2 more times for a total of 3 freeze/thaw cycles.
- 1 µL of benzonase was added per 5 mL of harvest and the cell lysate was incubated at 37°C for 1 hour.
- Cell lysate was then centrifuged for 15 minutes at 3000 rcf at 4°C and the supernatant was collected.
Expi293 media with HEK293 cells (7.2E06 cells/ml). Add 0.1% Tween-20 in media.
3 cycles of freeze/thaw (Freeze in -80°C for 40 mins and thaw in incubator 55°C till thawed)
1µL of benzonase per 5 mL of harvest was added. Incubated at 37°C for 1 hr

Centrifuged for 15 mins at 3000 rcf at 4°C. Collect supernatent
Figure 1: Preparation of crude cell lysate. Cells were lysed with Tween-20 and then underwent 3 cycles of freeze/thaw before treatment with benzonase, centrifugation, and supernatent collection.
Assay set-up for AAV2 in cell lysate
To have a single reference for all diluted samples and standards, all wells should contain an equal percentage of media/serum. To achieve this, the following steps were taken (refer to Figure 2 for an illustration of these steps)
1. Serially dilute the samples in media/serum. For example, for 1:2 dilutions of AAV in crude harvest, dilute 10 µL of the main stock solution into 10 µL of media (matching the composition of crude harvest media). This will dilute the concentration of AAV by half but keep the media percentage identical to the stock solution. Carry out further serial dilutions at 1:2 in media/serum,

2. Add 190 µL of diluent buffer into eppendorf tubes and add 10 µL of the AAV dilutions and mix by pipetting up and down. The dilution factor for the media, will be 1:20 for all of these tubes

3. Always include one reference in each run, and make sure that the reference well has the same composition as the other wells i.e. 1:20 dilution of media (without AAV) in diluent buffer.
4. Pipette all of the diluted samples into a 96 well plate and run the assay (120~600 mins, 1000 rpm).
Note: While working with purified AAV2 samples, first dilute the AAV2 in blank media followed by serial dilution as mentioned in Figure 2.
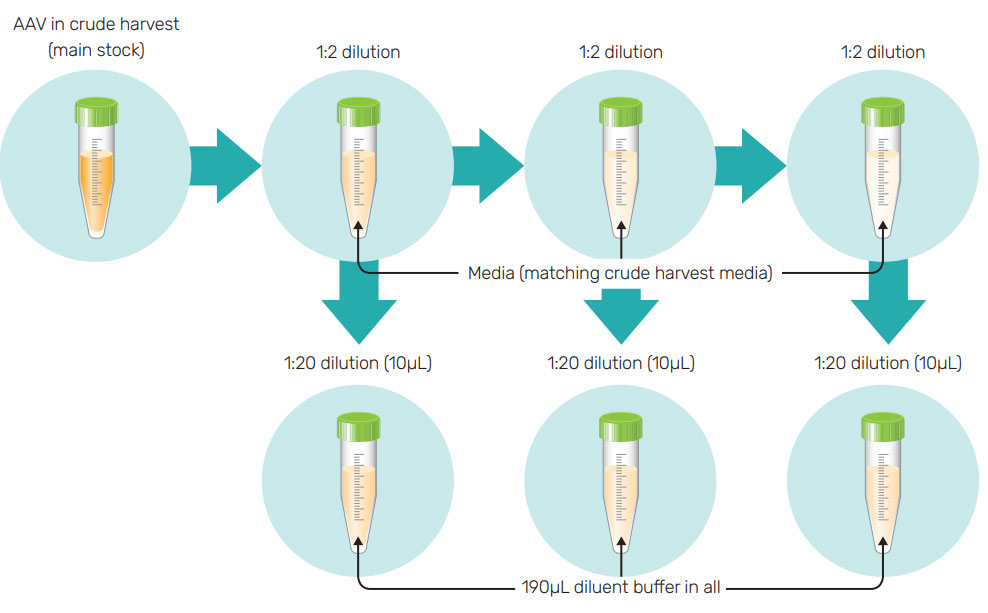
Figure 2: Ensuring media concentrations stay constant. Dilutions are made such that the percentage of media is the same for every well. The listed dilution factors are strictly volumetric. AAV and media dilution factors will depend upon the starting solution.
Results
Confirming AAV2 standards
The concentration of purchased AAV standards can often vary from the manufacturer’s specified values. Therefore, these standards cannot be used to evaluate the concentrations of unknown samples. Inaccurate determination of virus concentration during AAV capsid development and production leads to significant impact on product safety/efficacy, cause delays in production, and result in additional costs. Thus, in order to generate reliable and accurate quantitative results, the starting concentrations of any purchased standards should be confirmed prior to use.
AAV2 Empty capsid and Full capsid standards were purchased from Virovek and Packgene and evaluated by SDS-PAGE. In Figure 3, coomassie blue staining (left) is inconclusive as only Viral capsid protein 3 (VP3) is observed, whereas silver staining (right) shows all capsid proteins for both standards. Virovek standards were supplied with a reported concentration of 2E+13 vp/mL for both AAV2 Empty and Full capsid whereas Packgene standards were reported to have concentrations of 1E+13 vp/mL for both AAV2 Empty and Full capsid. Thus for both vendors, the ratio of Full/Empty should theoretically be 1. However, the silver stained data indicates significant concentration difference between Empty and Full standards from both vendors. The Virovek Empty capsid standard is more concentrated than the Full standard with a Full/Empty ratio of 0.33. For the Packgene standards, the Empty capsid standard is less concentrated than the Full capsid standard and the Full/Empty ratio is 3.33.
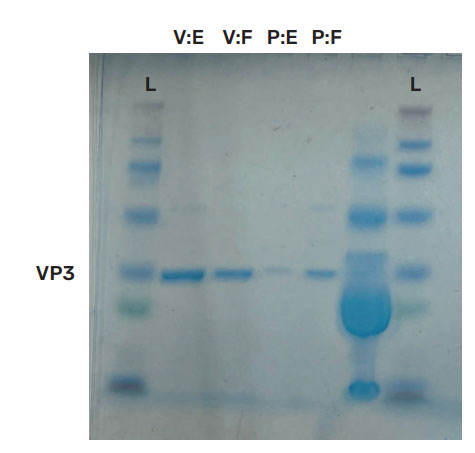
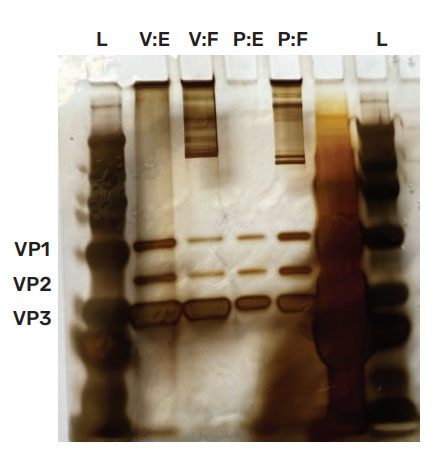
Figure 3: SDS PAGE. AAV2 standards were tested using SDS PAGE with coomasie blue staining (left) and silver staining (right). Coomassie blue staining is inconclusive. However, silver staining illuminates all viral capsid proteins (VP1 = 87kDa; VP2 = 72 kDa; VP3 = 60 kDa) and indicates a discrepancy between reported and observed concentrations. The ratio of Virovek Full (V:F) to Virovek Empty (V:E) is 0.33 and the ratio of Packgene Full (P:F) to Packgene Empty (P:E) is 3.33. Based upon the vendor supplied concentrations the ratios should be 1.
The concentrations of Virovek AAV2 Empty and Full capsids were further evaluated using the PROGEN AAV2 ELISA kit. Two separate lots of Empty capsid standard were tested, with lot 2 being the same as shown above in the SDS-PAGE study. As shown in the table below (Table 1), the concentrations between both lots differed from one another, and were significantly different from the reported value of 2E+13 vp/mL. For lot 2, the Full/Empty plasmid concentration ratio was indeed 0.33, consistent with the SDS PAGE data. For all subsequent studies, the Virovek AAV2 Empty capsid standards were used and the starting concentration for the preparation of dilution series standards was adjusted to reflect the measured value from the ELISA data.
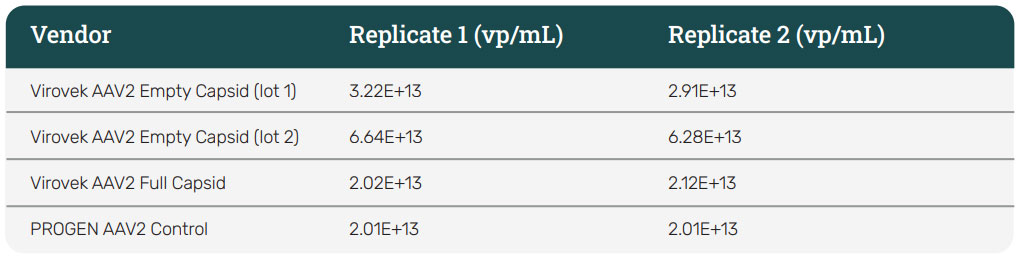
Table 1: ELISA data for AAV2 standards. Virovek AAV2 Empty and Full capsid standards were tested using the Progen AAV2 ELISA kit (Absorbance data at 450 nm). Two different lots of Empty standards differed significantly from each other and from the vendor-reported concentration of 2E+13 vp/mL. For lot 2, the Full/Empty plasmid concentration ratio of 0.33 was consistent with the data achieved for this lot from silver staining.
AAVX probe experiments
Crude harvest media (AAVX probe)
Figure 4 shows the standard curve generated using a dilution series prepared from Virovek AAV2 Empty capsid standards spiked into crude harvest media and measured using the AAVX probe. An expanded region showing the blank and the lowest concentration are shown on the right. Here, a stock solution of 1:20 dilution of crude harvest media in Q Buffer + 0.01% Pluronic F68 buffer was used for standard preparation. All standards contain the same concentration of media to ensure accurate quantitation. The results shown here demonstrate that AAV2 can be rapidly quantified in one step as low as 9.2E+08 vp/mL from crude media using the AAVX probe
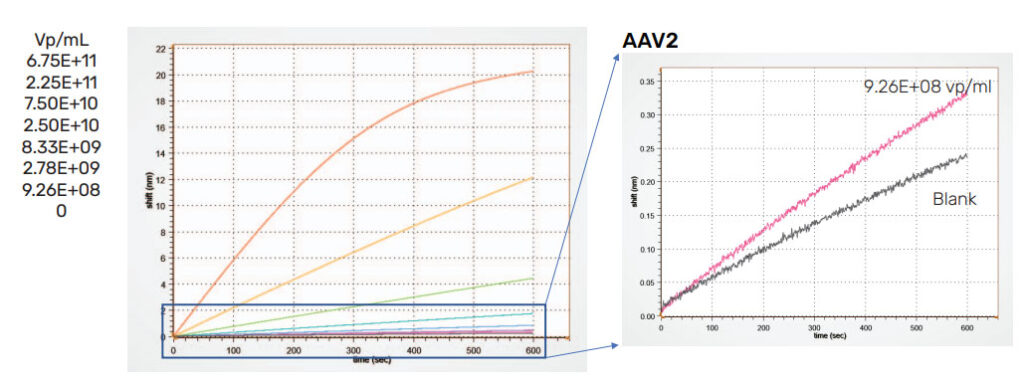
Figure 4: AAVX probe standard curve for Virovek AAV2 empty capsid standards. A quantitation range between 9.26E+08 to 6.75E+11 vp/mL is achieved. Left, all standards. Right, expanded region displaying the lowest concentration standard and a blank.
Minimizing NSB through dilution (AAVX probe)
NSB is a detrimental factor for any antibody-based method, particularly for samples in crude or dirty matrices. For biolayer interferometry (BLI), NSB can affect the overall accuracy of the measurement as well as degrade the probe more quickly over time. NSB most likely interfered with detection of AAV2 from the crude cell lysate samples.
Dilution of dirty or crude matrices can reduce NSB. To illustrate this, spent media diluted using different buffers is shown in Figure 5. These samples contain no viral particles and should exhibit no binding signal. Yet, some binding is observed due to NSB. On the left, the BLI graph shows the NSB when spent media is tested neat or diluted with different concentrations of PBS+0.001% pluronic. The right curve shows spent media diluted with Q buffer, K buffer and PBST buffer. Dilution of media in Q buffer results in the greatest reduction and significantly reduces the NSB to < 0.2 nm for a 5 min assay.
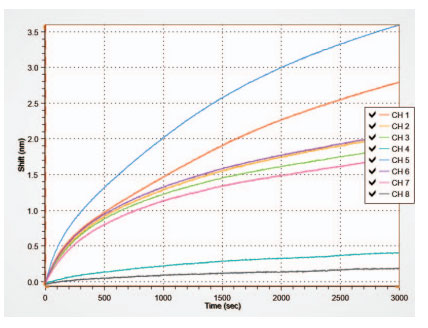
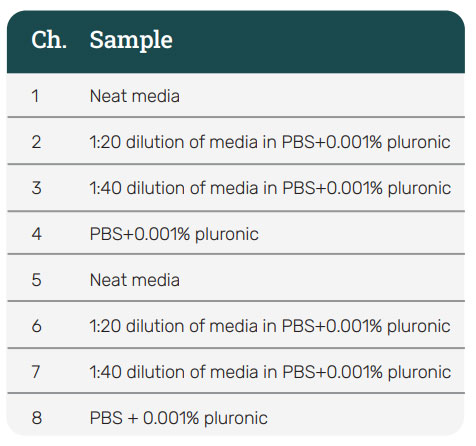
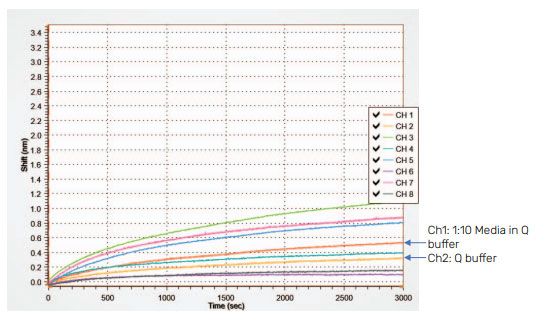
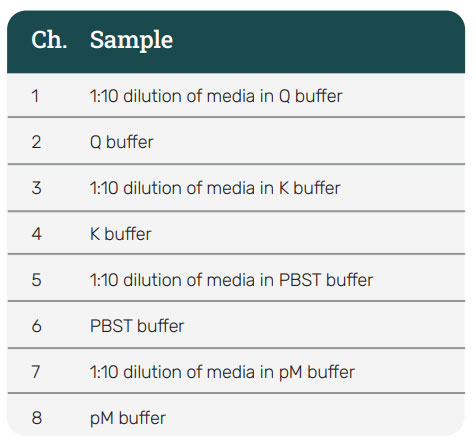
Figure 5: AAVX probe diluent buffer test for spent media. Neat media is diluted into PBS+0.001% pluronic (left) and Q buffer, K buffer, and PBST buffer (right). While dilution helps to decrease NSB in PBS+0.01% pluronic, K buffer, and PBST, dilution into Q buffer shows the greatest reduction of all.
Diluted harvest media (AAVX probe)
To further illustrate the effects of dilution, Virovek AAV2 Empty capsid standards were spiked into media and diluted to a concentration of 2.5E+10 vp/mL. For samples diluted with PBS+0.01% Pluronic, NSB interfered with the assay. In contrast, dilution using Q buffer provided accurate signals and minimized NSB (Figure 6). The response from AAV2 in media and Q buffer is almost identical to the response from AAV2 spiked into Q buffer alone, indicating that dilution of the media is quite effective at reducing NSB. The same test was repeated for Virovek AAV2 Full capsid and for Pakgene AAV2 Empty and Full capsid (data not shown). In all cases, Q Buffer resulted in the greatest reduction of NSB. However, diluting the AAV sample with Q Buffer can result in AAV concentration falling below the AAVX probe’s limit of detection.
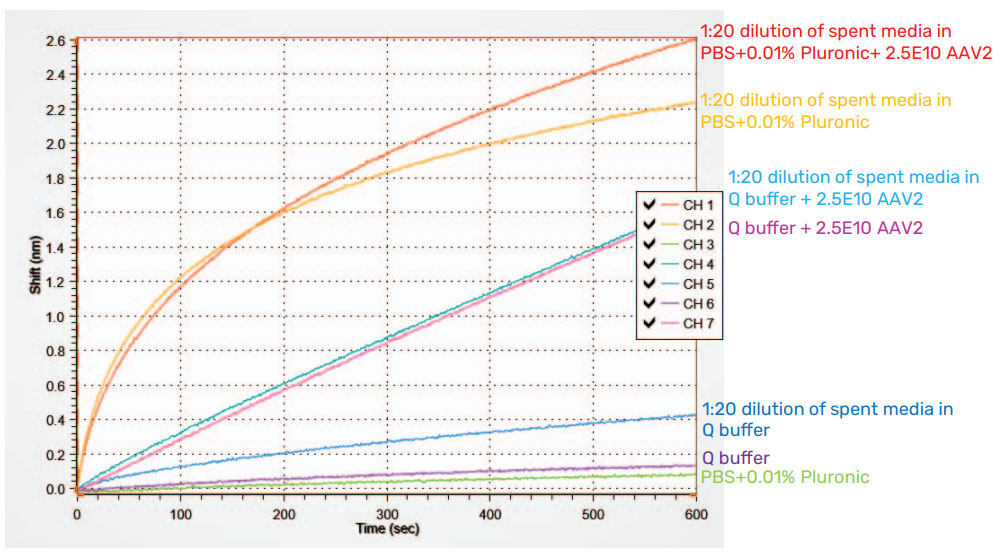
Figure 6: AAVX probe measurement of Virovek AAV2 Empty capsid standard spiked into media and diluted. Dilution of AAV2 in media with Q buffer virtually eliminates non-specific binding from media and produces results that are similar to AAV2 in Q buffer alone.
HS AAV Kit
Diluted harvest media (HS AAV kit)
Although dilution using Q buffer reduces NSB, the AAV concentration in samples that are already at the lower end of the range of AAVX, may fall below the detection range of the AAVX probe. For these cases, HS AAV kit should be the product of choice.
Shown in Figure 7, is the standard curve for AAV2 standards prepared in crude media and diluted 100x in Q buffer and measured using the HS AAV kit. Samples were tested at 1:100 dilution in Q buffer to reduce NSB, which kept the concentrations within the dynamic range of the assay. The assay is sensitive and can quantitate AAV2 as low as 3.13E+08 vp/mL with high accuracy in only 30 minutes.
Figure 7: HS AAV kit measurement of Virovek AAV2 Empty capsid standards in diluted media. AAV2 standards were spiked into media and diluted 1:100 using Q buffer. A quantitation range between 3.13E+08 to 1E+10 vp/mL is achieved.
Detection of AAV2 in diluted crude cell lysate
Using the HS AAV kit, AAV2 was measured from crude cell lysate samples. As shown in Figure 8, channel 2 (CH2) shows a binding response for the transfected sample diluted 1:100 using Q buffer. After reference subtraction, the tested sample concentration appeared to be less than the concentration of the lowest standard (3.13E+08 vp/mL), and thus could not be accurately quantified from these experiments alone.
To make sure all AAV2 was being released by the preparation of the crude cell lysate, the cellular debris left over after sample preparation was homogenized and prepared for analysis. As shown in channel 4 (CH4) (Figure 8), the homogenized sample shows significantly more specific binding than the non-homogenized sample. Based on these data, the calculated stock concentration of the homogenized sample is 2.79E+10 vp/mL. After reference subtraction, the AAV2 concentration within the transfected sample (non-homogenized) was 8.50E+07 vp/mL. Accounting for the 1:100 dilution factor, the AAV2 concentration from the stock solution is calculated to be 8.50E+09 vp/mL. These results indicate that the AAV2 was not fully released from the host cells during cell lysis; and the sample preparation protocol should be further optimized.
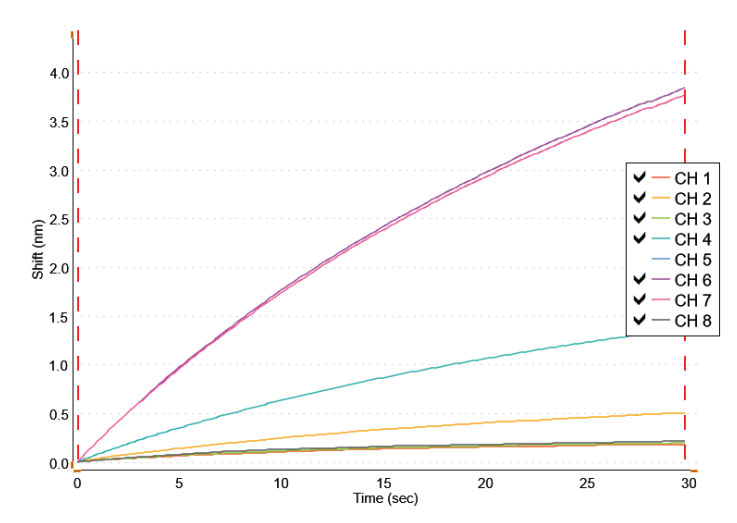
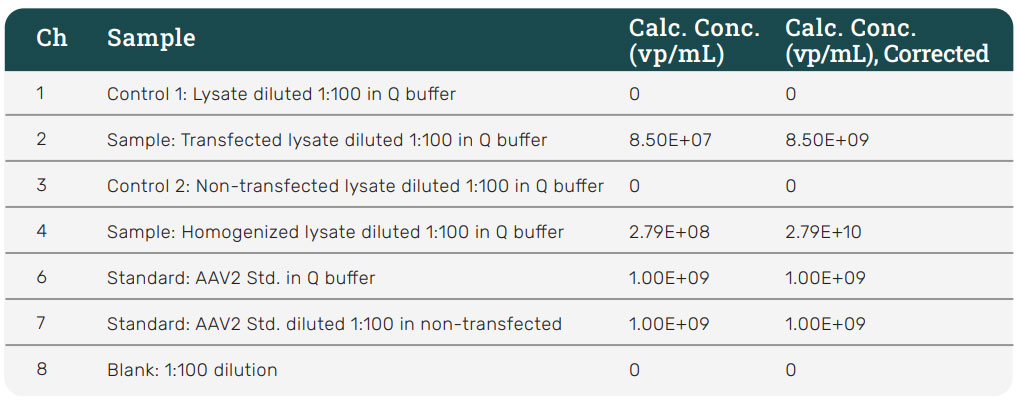
Figure 8: HS AAV kit measurement of AAV2 samples. Cell lysate samples were tested for AAV2 using the HS AAV kit. Channel 2 (CH2) shows a response for AAV2 from the cell lysis supernatent sample diluted 1:100 in Q buffer but below the quantitation limit. Channel 4 shows a much larger response for AAV2 from a sample prepared from homogenized cellular debris diluted 1:100 in Q buffer, and now within a quantifiable range. The results indicate that the sample preparation of cell lysate needs to be further optimized to fully release AAV2 from the cells.
To confirm the presence of AAV2, the cell lysis and homogenized samples were analyzed using the PROGEN AAV2 ELISA kit (Figure 9). Due to matrix effects, the ELISA data could not accurately determine the titer for AAV2 in the cell lysis samples but could determine the concentration within the homogenized samples as it was more concentrated. ELISA replicate measurements had higher variation than those from the Gator® HS AAV kit. The Gator® HS AAV kit provided better precision and consistent titer values across multiple runs.
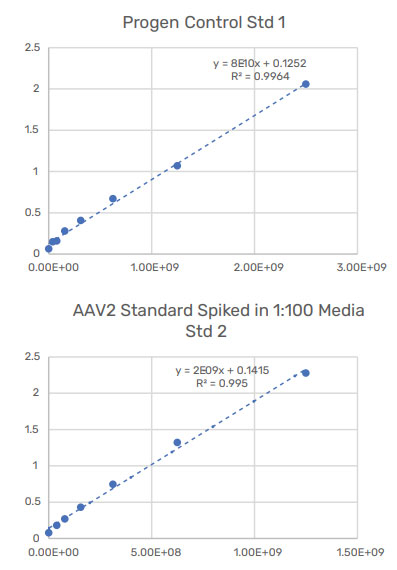
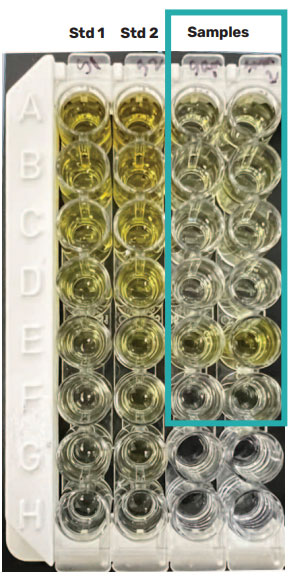
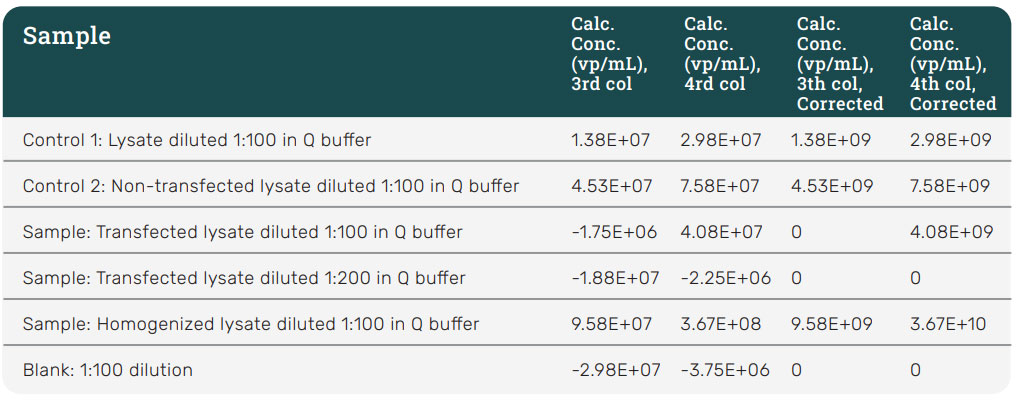
Figure 9: ELISA data for cellular samples. ELISA was able to measure the concentration of AAV2 in the homogenized sample, but its data set for the transfected cell lysate was inconclusive due to matrix effects. Although ELISA concentration values are consistent to that of the HS AAV kit analysis, its replicate measurements had higher variation than that of the HS AAV kit. Values are consistent with the HS AAV kit analysis. ELISA replicate measurements had higher variation than HS AAV kit.
Robustness of the HS AAV kit to various matrices
With a proprietary polymer coating on the sensor surface and a sandwich assay format, the assay is more tolerant to NSB across various matrices. This allows for more of the specific signal for the AAV to be amplified, leading to excellent sensitivity and recovery (Table 2). With these specifications, the kit is a great fit for upstream, crude harvest samples; downstream, clarified harvest samples, and purified samples.
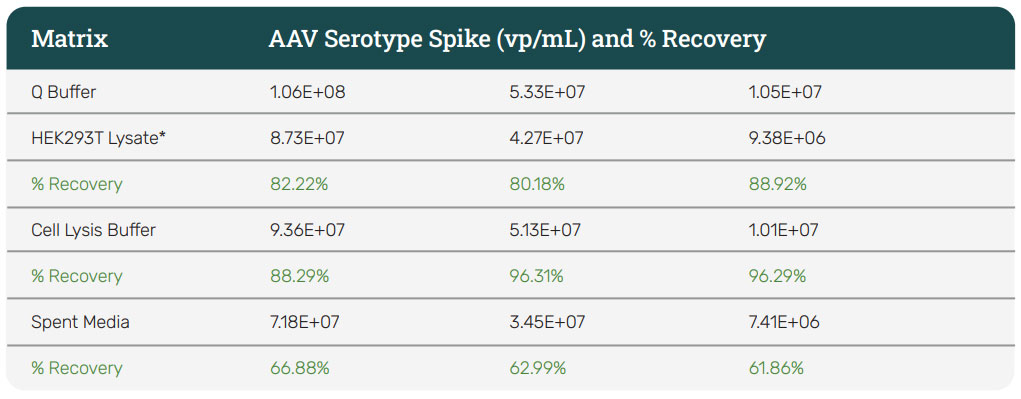
Table 2: Percent recovery for different matrices. The percentage recovery of AAV spiked into different matrices is shown in the table. HEK293T Lysate = Intracellular proteins from ~100 mg/mL of cells in PBS diluted 1:10 in Q buffer. Cell Lysis Buffer = 1x PBS, 100 mM NaCl, 0.01% Pluronic. Spent Media = DMEM media, 10% FBS, 2 mM L-Glutamine.
Conclusion
The AAVX probe supports serotypes 1-10 and chimerics, and the HS AAV kit support serotypes 1-8 and 10. The AAV9 probe and HS AAV9 kits exclusively supports AAV9. The AAVX probe offers a fast and convenient method for determining AAV concentration down to 5E+09 vp/mL in crude lysates in only a few minutes while the HS AAV kit enables quantitation down to 1E+07 vp/mL in crude lysates. In complex matrices where NSB can be a detrimental factor, dilution with Q buffer can significantly reduce non-specific binding and enable titer determination limits using the HS AAV kit. Additionally, for very low sample concentrations, replicate analyses show that lower variability and higher precision using the HS AAV kit than using ELISA (Table 3).
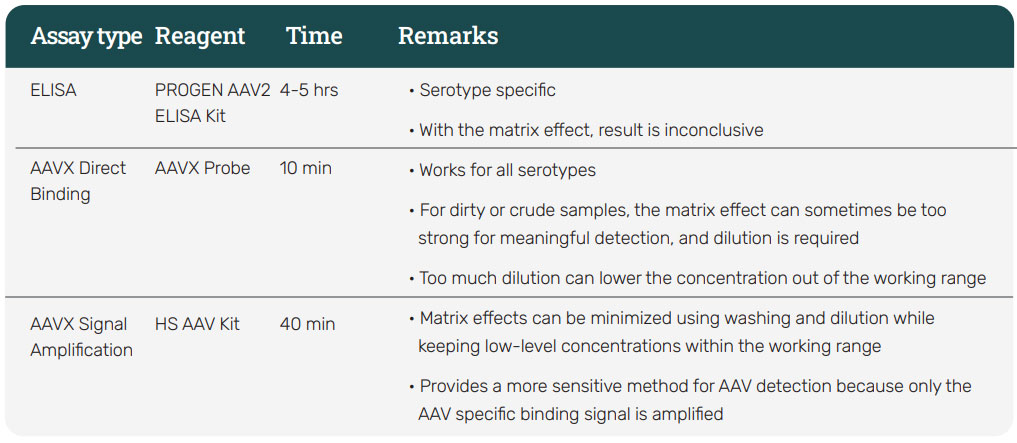
Table 3: Assay Performance Summary. The benefits of the AAVX probe and HS AAV kit are summarized in the table above.
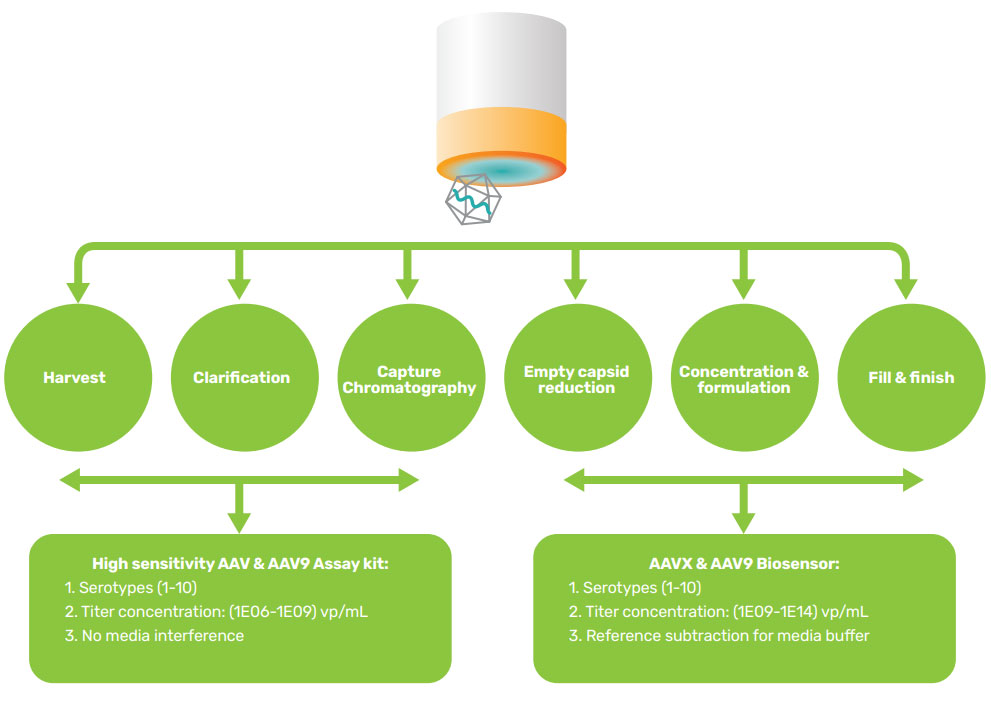
Figure 10: AAV Biosensor / AAV Assay Kit Selection Guide for AAV Titer. Gator Bio offers AAV titer solutions to support the entire AAV production pipeline. With both rapid and high sensitivity assays available, the automated AAV titer solutions enable titer determination with wide dynamic range for serotypes 1-10 in both crude and purified samples.
Key Takeaways
- 2 minute AAV crude lysate assay with dynamic range from 1E+13 vp/mL – 5E+09 vp/mL using the AAVX probe.
- 30 minute AAV crude lysate assay with dynamic range from 5E+09 vp/mL – 1E+07 vp/mL using the HS AAV kit